Features and functionality described on this page are available with our new Pro and Enterprise plans. Learn More... |
The Bars GDO plots a filled rectangle for each group. The bar extends from the baseline to the position of a summary statistic (Mean, Median, or Geometric Mean) calculated from the data values in that group.
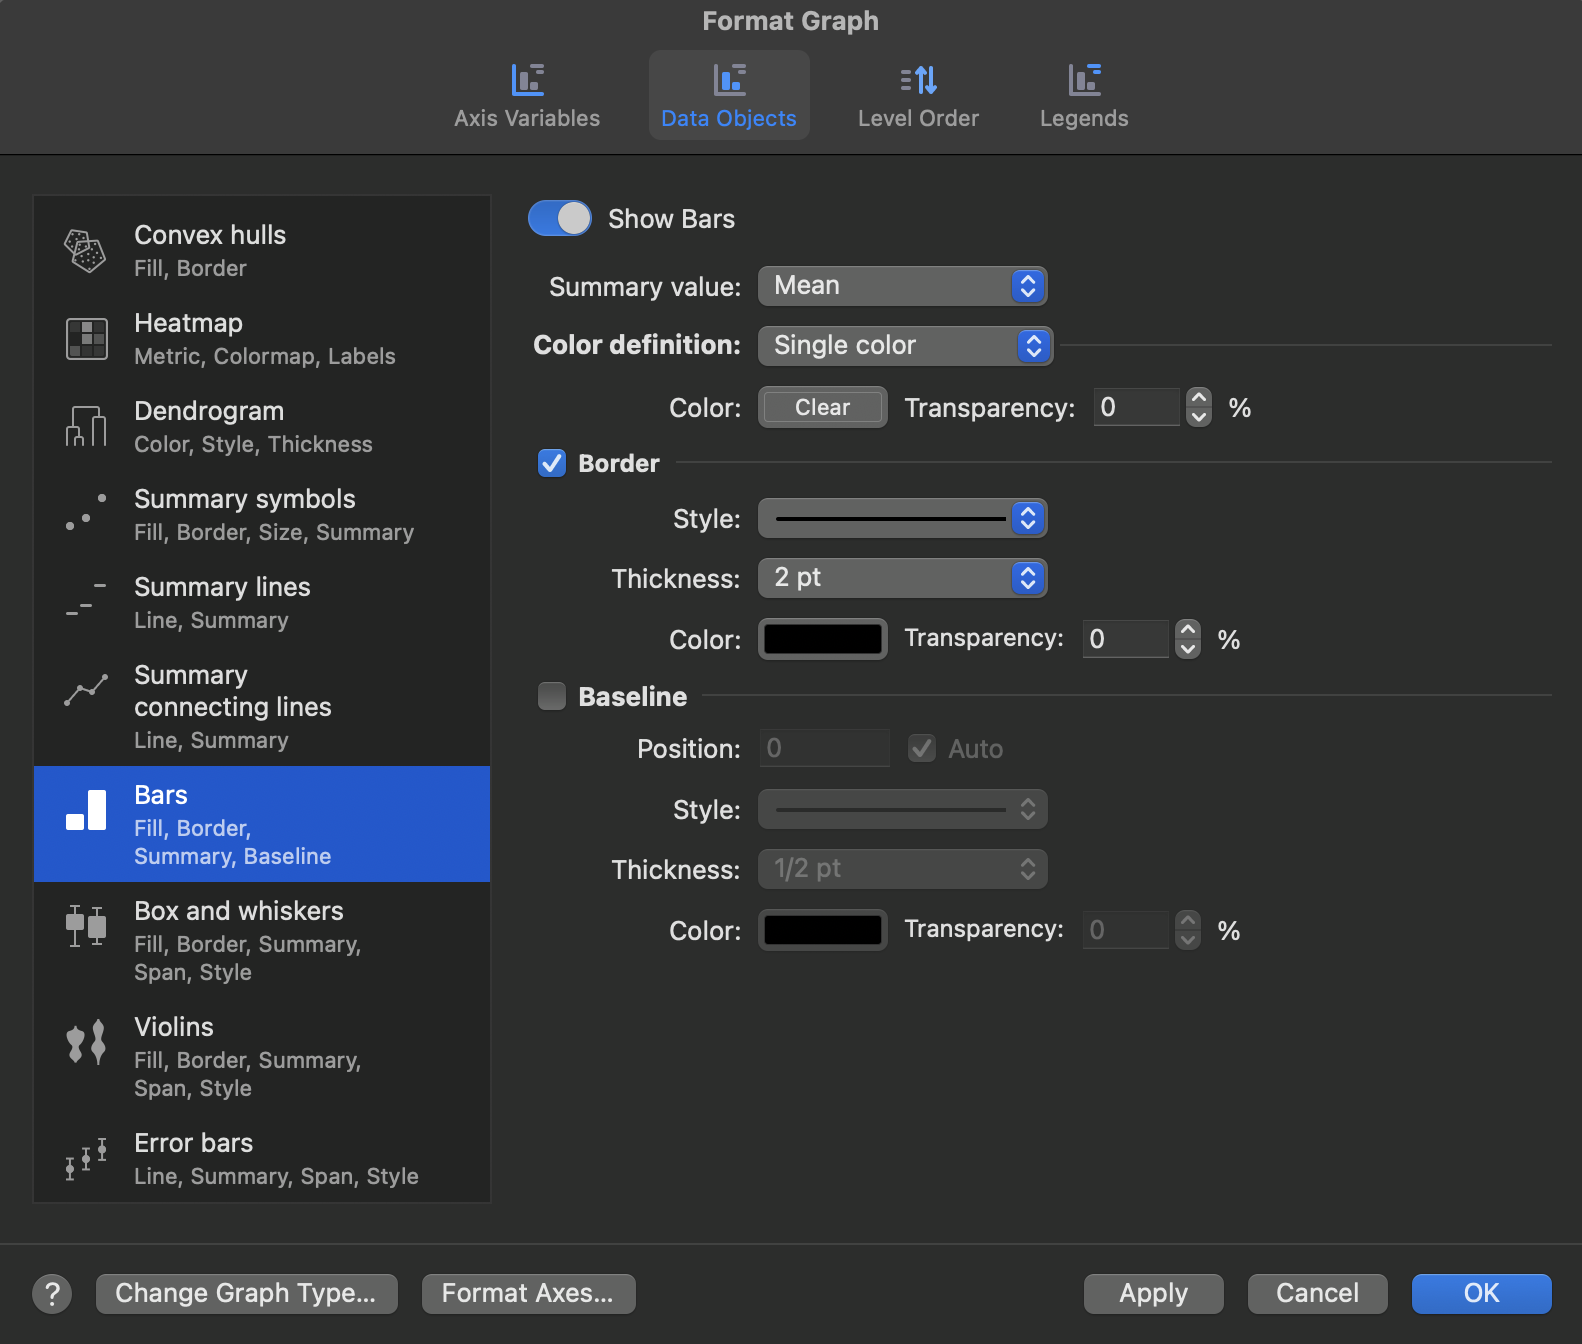
Summary value
The bar-end position along the continuous axis is determined by the Summary value type. This option can be set independently for each group. The available summary values are:
•Mean
•Median
•Geometric Mean
Border
Border options can be set independently for each group:
•Border visibility: show or hide the bar border.
•Border stroke color.
•Border stroke thickness.
•Border stroke style: options are Solid, Dash, Dot, DashDot, and DashDotDot.
Baseline
The baseline is the value on the continuous axis where each bar begins. Baseline options apply to the GDO as a whole:
•Baseline visibility: show or hide the baseline as a drawn line on the graph.
•Custom baseline position: the value along the continuous axis at which bars start.
•Baseline stroke color.
•Baseline stroke thickness.
•Baseline stroke style: options are Solid, Dash, Dot, DashDot, and DashDotDot.
Color settings
Color settings apply to the GDO as a whole. Bar fill color can be defined in three ways:
•Single color: all bars use one fill color.
•Continuous variable: a gradient colormap is applied based on a summary statistic (Mean, Median, or Geometric Mean) computed from a selected continuous variable. Each bar is colored according to its group's computed value.
•Categorical variable: each level of the selected variable is assigned a color from the active color scheme. If a group in the axis variable corresponds to multiple levels of the color variable, it receives the color assigned to the "Undefined" level.