Features and functionality described on this page are available with our new Pro and Enterprise plans. Learn More... |
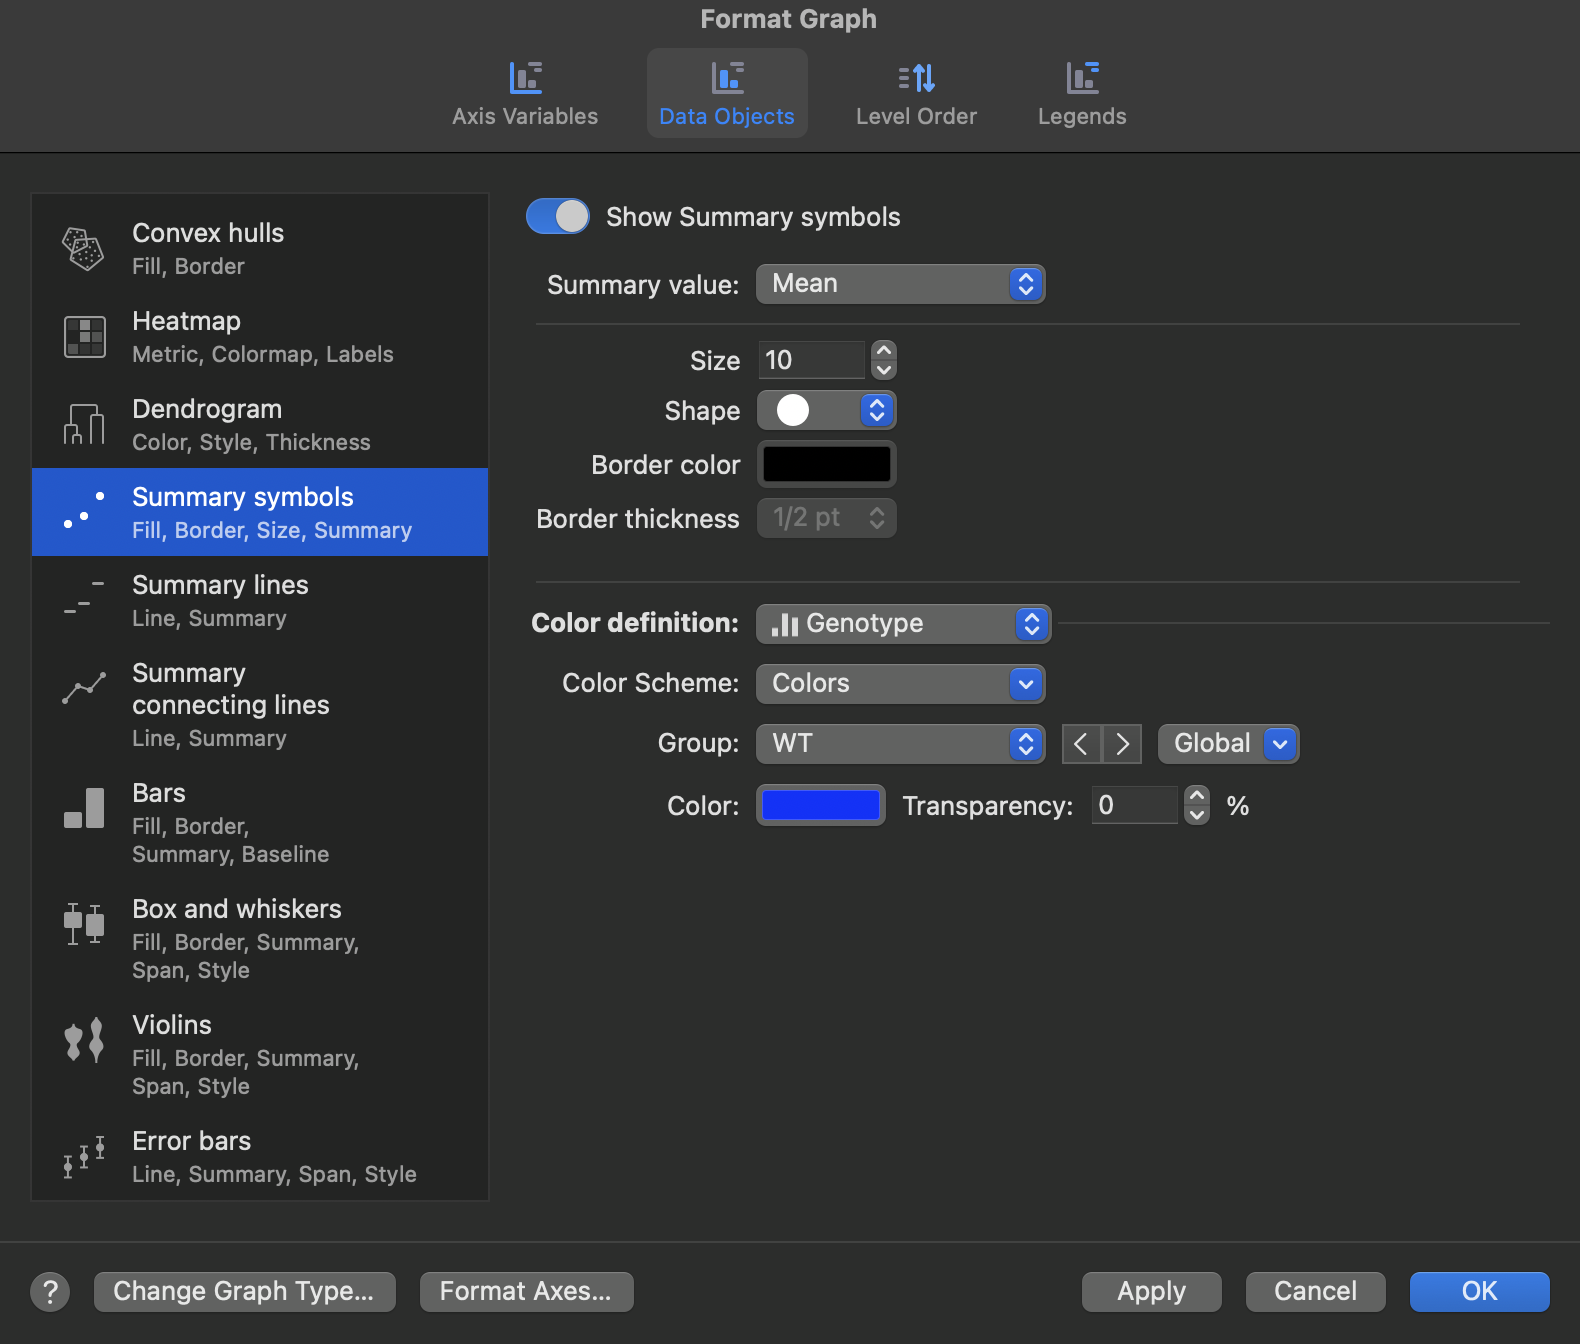
The Summary symbols GDO plots one symbol per group at the position of a summary statistic calculated from all data values in that group. Unlike scatter symbols, which plot one point per row of data, summary symbols aggregate values within each level of the categorical axis variable to produce a single symbol per level.
Summary value
The position of each symbol along the continuous axis is determined by the Summary value type. This option can be set independently for each group. The available summary values are:
•Mean
•Median
•Geometric Mean
Symbol appearance
The following appearance options can be set independently for each group:
•Shape: choose from any of Prism's standard symbol shapes, or select a custom character from any font installed on your computer.
•Symbol size: drawing size in points.
•Symbol border color.
•Symbol border thickness: border stroke thickness in points.
Color settings
Color settings apply to the GDO as a whole. Symbol fill color can be defined in three ways:
•Single color: all symbols use one fill color.
•Continuous variable: a gradient colormap is applied based on a summary statistic (Mean, Median, or Geometric Mean) computed from a selected continuous variable. Each symbol is colored according to its group's computed value.
•Categorical variable: each level of the selected variable is assigned a color from the active color scheme. If a group in the axis variable corresponds to multiple levels of the color variable, it receives the color assigned to the "Undefined" level.