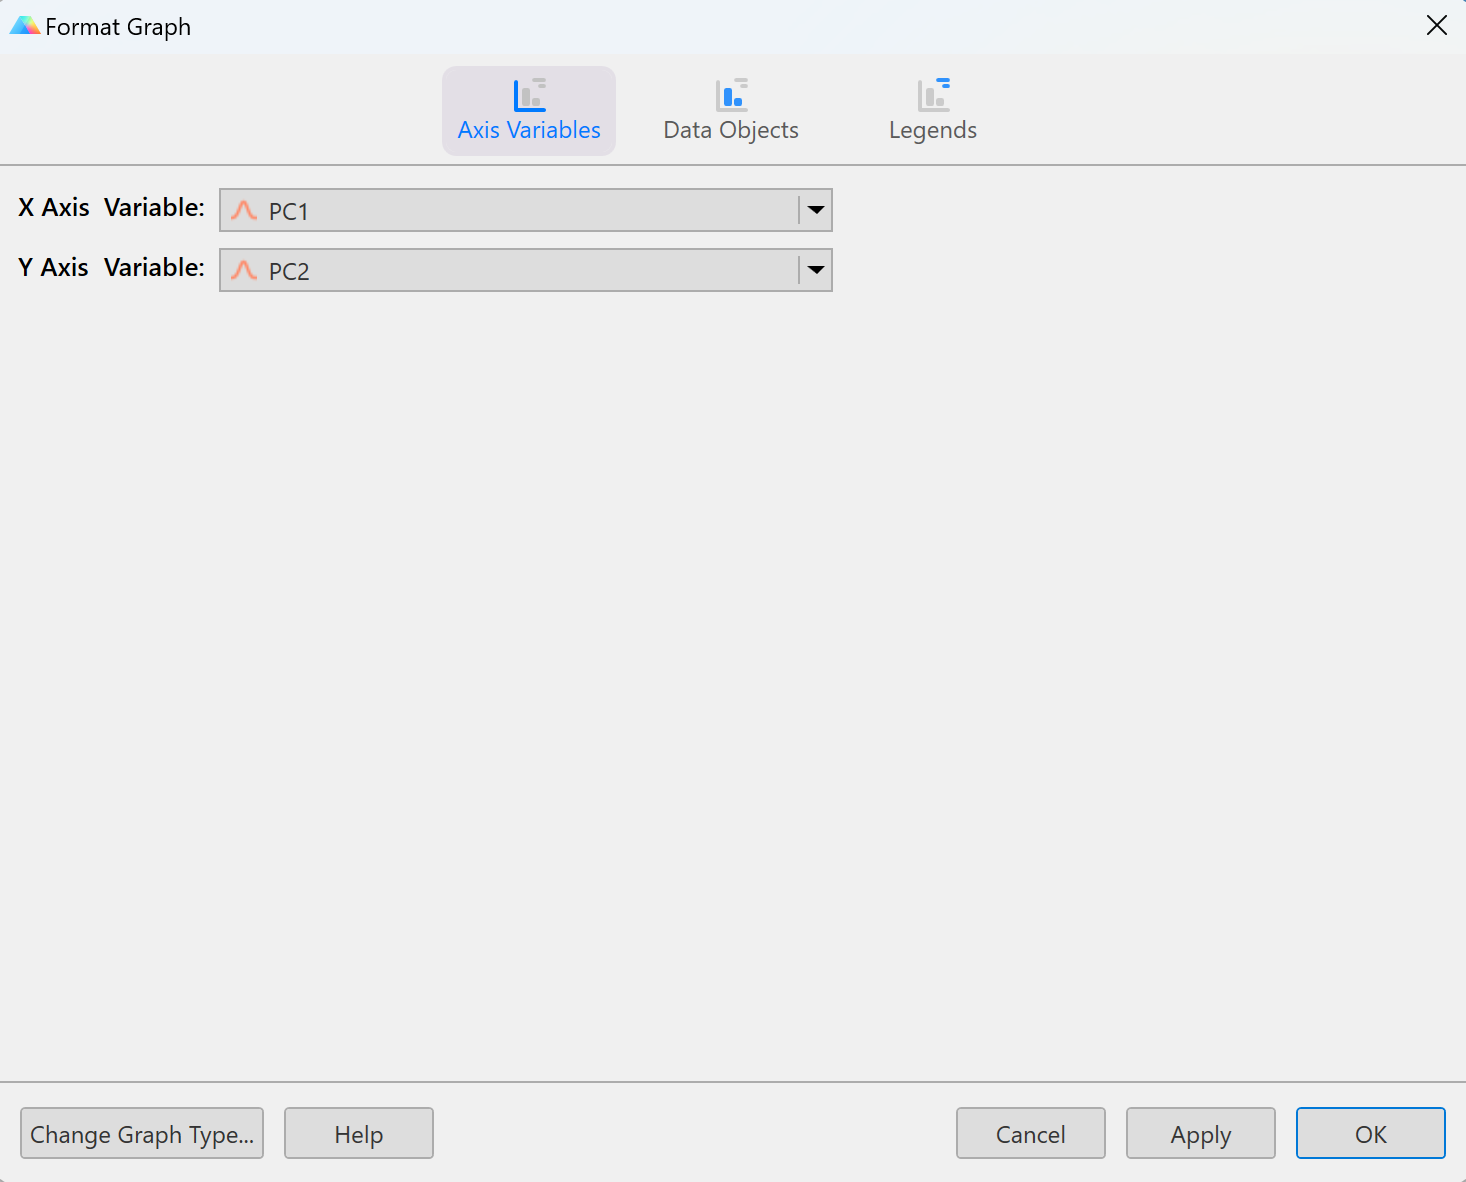
The options in the Axis Variables section of the Format Graph dialog will determine where on the graph your data will be plotted. In some cases, the selections here may also determine which data objects you’ll be able to display on the graph. There are two dropdown boxes: one for the X (horizontal) axis and one for the Y (vertical) axis. These dropdown menus will display the variables in the data table from which the graph is being created. When using continuous variables assigned to the X and Y axes, the value of the variable assigned to the X axis will determine the horizontal coordinate, while the value of the variable assigned to the Y axis will determine the vertical coordinate.
These axis variable dropdown menus also include the options “Rows” and “Columns”. The “Rows” and “Columns” options can only be used together (if “Rows” is assigned to the vertical axis, “Columns” will be assigned to the horizontal axis and vice versa). Note that the data objects available for the graph will depend on the combination of variables (or “Rows and “Columns” options) selected here. Notably, you may choose to use “Rows” and “Columns” as your axis assignments when creating a heat map of your data. This will treat the data in the table as a matrix, where each value can be plotted as a cell of the heat map. Alternatively, you may create a heat map by choosing two categorical variables to define your axes. In this case, you may have multiple values that can be summarized (average, median, percent, etc.) for each cell of the heat map.
Pairing a categorical variable with a continuous variable
Features and functionality described in this section are available with our new Pro and Enterprise plans. Learn More... |
Assigning a categorical variable to one axis and a continuous variable to the other produces a graph in the style of a classic column graph, and makes the summary data objects available: summary symbols, summary lines, summary connecting lines, bars, box and whiskers, violins, and error bars.
•Assign the categorical variable to the X axis for a vertical graph, in the style of a vertical column graph.
•Assign the categorical variable to the Y axis for a horizontal graph, in the style of a horizontal column graph.
The axis holding the categorical variable is divided into equal-length segments, one per level of that variable. All enabled data objects for a given level are drawn together within that level's segment. To control the order in which the levels appear along the axis, use the Level Order tab.
For a walkthrough of the graph types this combination makes possible, and how to create them from the Create New Graph dialog, see Categorical graphs from multiple variables data.
Other limitations
All variables used on a multiple variables graph must come from the same data table. Only one variable can be assigned to each axis, and (for now) multiple variables graphs can only have one Y axis.